Temperature Profiler for Reflow-, Wave-, and Vaporphase Soldering
Thermologger 5000
Update:
In the new version with the additional thermal box the Thermologger 5000 is also suitable for vapor phase ovens
Accurately defined temperature profiles are an indispensable condition for perfect soldering results in a soldering process. Particularly in the course of the lead free conversion the adjustment of the temperature profiles represents a large challenge. With the new developed 5 channel temperature profiler from Stannol you have an economical and reliable possibility to setup and control your soldering processes.
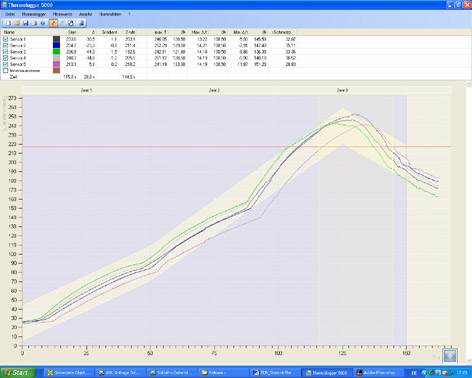
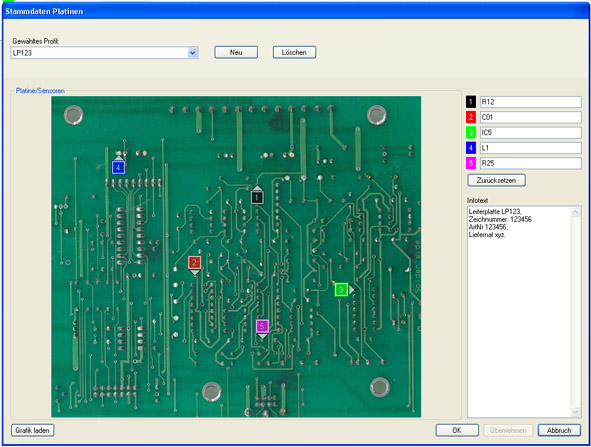
The PCB on the right shows the selected test points as displayed in the above graph. The curves show the temperature deviation at each particular test point.
The component mass, surface area and individual conductivity will determin how fast the particular componten will follow the oven temperature.